What we’re doing
CRAG encourages members of our organisations to contribute to the maintenance and improvement of the water quality, health and biodiversity of the River Coquet and its catchment.
Currently much of our effort is aimed at gathering information about the river and making contact with other groups who have an interest in the river. We will use the knowledge that we gather to encourage other organisations to make changes.
Many of our member groups are engaged with a wider environmental agenda than just the River Coquet. Relevant here are their actions to enhance biodiversity within the River Coquet catchment. For example, tree planting in the valley of the Hazon Burn is a positive example of action to increase biodiversity, to mitigate impacts of flooding, soil erosion and storm impact related to climate change and to link woodland corridors along tributaries of the Coquet to the main river woodlands.
Our test locations:
Test locations for physical and chemical tests were selected on the understanding, where possible, that these locations would also be used for biological surveys. Locations were chosen by each local group using the following guidance:
- Sites would be safe for testing regardless of river level and environmental conditions
- Sites were placed where permission for access was available from landowners
- When testing point sources of pollution, sites would be paired, where possible, upstream and within 100 metres downstream of the pollution source
- Testing of burns would occur at least 10 metres upstream of where the burn joined the main river
Once selected, a risk assessment of the site was undertaken.
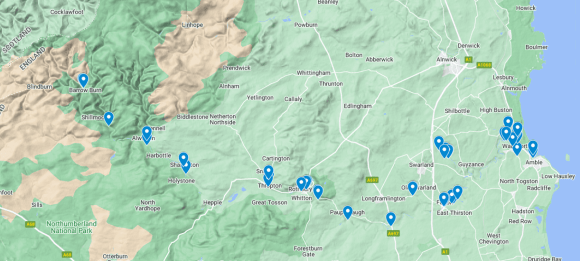
As of the end of 2024, we now are testing at 40 site on the River Coquet and tributaries. Check out the regions of the river below for more details.
Water quality testing
physical and chemical tests
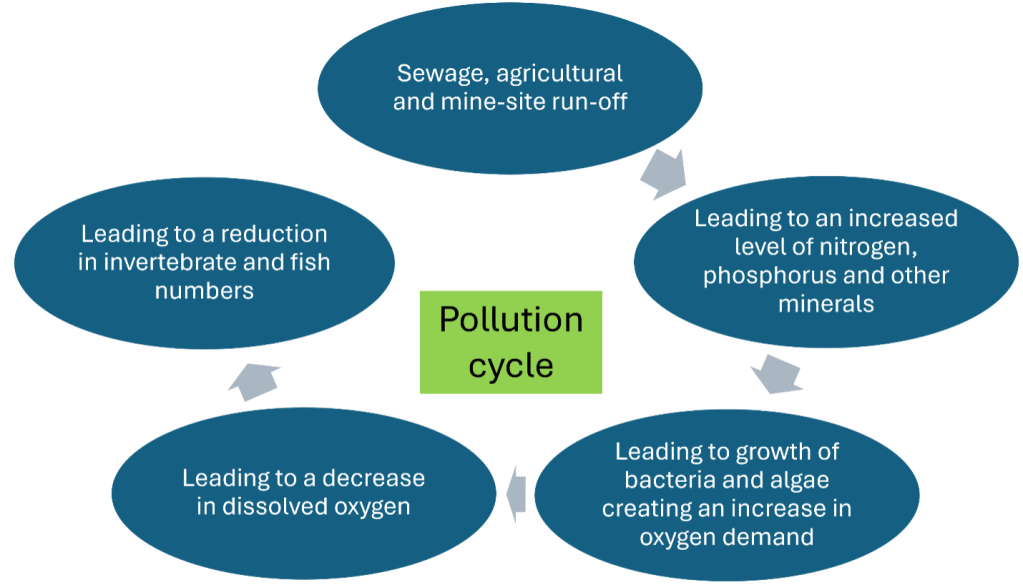
By understanding the pollution cycle and with reference to the Water Framework Directive, we have selected physical and chemical tests that help us monitor the health of the river. These are tests that have been recommended to us by the Environment Agency. They are also tests that are commonly used by other Citizen Science groups in the UK.
The most important tests are for those chemicals considered limiting for bacteria and algae growth. In freshwater (most of the river) the limiting chemical is generally phosphorus. In estuarine and seawater the limiting chemical is generally nitrogen.
Our long-term and regular monitoring of physical and chemical properties, alongside those of the Anglers Association, the Environment Agency and other government and non-government organisations, will provide evidence for improvement or deterioration of the water quality of the Coquet River.
The scientific relevance of our testing depends upon groups along the Coquet using the same tests, receiving the same training and testing water samples at the same time. In general, this is the case for groups that are part of CRAG; however, we have allowed for some local flexibility in:
- The tests used – to ensure the chosen tests are relevant to fresh water or estuarine water
- The timing – because some groups choose to test more regularly

The physical and chemical tests CRAG groups have chosen to perform are (see biological surveys and tests in the next section):
| Fresh water | Estuarine | |
| All groups | – pH and temperature – Ammonia and phosphate – Dissolved solids (electroconductivity) | – pH and temperature – Ammonia and phosphate – Salinity |
| Some groups (depending on local preference, cost and suitability for local test sites) | – Nitrate – Suspended solids (turbidity) – Biological oxygen demand (BOD, permanganate) | – Nitrate – Turbidity |
We carry out physical and chemical tests at least once a month at each test site (hyperlink to ‘CRAG Background and rationale for water quality testing’ in Knowledge Hub). We capture results in the ‘Coquet River Action Group’ EpiCollect project. The Environment Agency monitors our results and uses them to trigger investigations of water quality.
Water quality testing
biological surveys
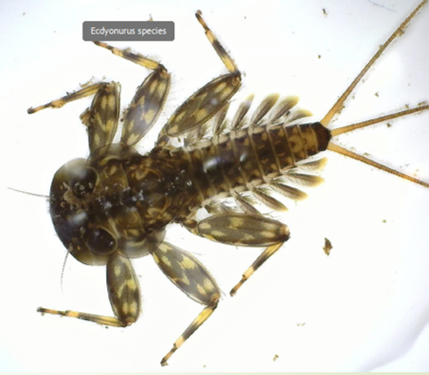
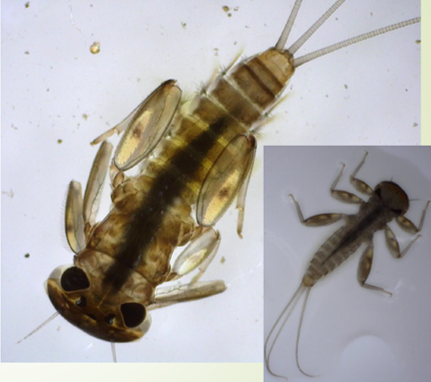

Perhaps the best measures for the overall health of rivers are biological. If the number and composition of the fish and insects are changing, then this suggests that the health of the river is also changing. In particular, river-fly (invertebrate larvae) are considered to be ‘indicator’ species – a decrease in the number of river-fly or a change in the composition of species of river-fly indicate that river health is decreasing.
We are encouraging groups within CRAG to survey for river-fly twice a year using the kick-test methodology developed for the Anglers’ Riverfly Monitoring Imitative (https://www.riverflies.org/riverfly-monitoring-initiative-rmi), now run by the Riverfly Partnership. Our guidance document is here (hyperlink to ‘CRAG riverfly survey guidance’ in Knowledge Hub). We capture results from riverfly surveys in the ‘CRAG riverfly survey’ EpiCollect project.
We receive monthly fish count data for migratory fish from the Northumberland Rivers Trust. They have a fish counter on the Guyzance weir.
Standards that we measure against
Where possible, CRAG compares physical and chemical test results against national standards. There are four sets of standards that must be considered:
- The Water Framework Directive (WFD) (https://www.legislation.gov.uk/uksi/2017/407/contents) – the main set of standards that describes the chemical and biological tests that should be used to assess the quality of water. The organisation tasked with updating this guidance document and adjusting standards to UK condition as scientists learn more is UKTAG. Their website has updated guidance for some WFD standards (https://www.wfduk.org/resources/category/environmental-standards-202/publication-status/3).
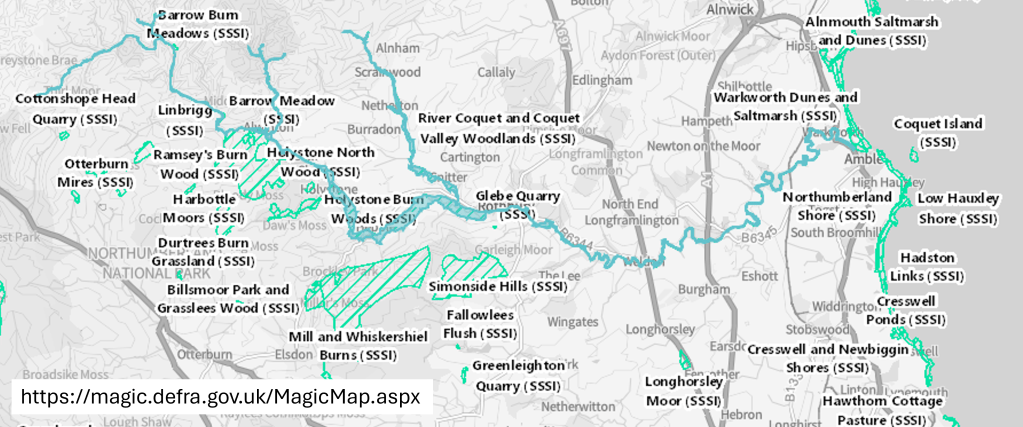
- The Common Standards Monitoring Guidance for Rivers (CSMG) (https://jncc.gov.uk/our-work/common-standards-monitoring-guidance/) – standards for a smaller set of chemical tests specific to SSSI (Site of Special Scientific Interest). The Coquet from source to the tidal limit and two major burns (Alwin catchment and Wreigh burn from the Netherton burn to the Coquet) are part of the River Coquet and Coquet woodlands SSSI. In addition to this main river SSSI, there are many woodland SSSIs in the Coquet catchment and SSSIs along the coast.
- The WFD does not have standards for nitrate, yet nitrate levels are likely to be of concern in some of the lowland arable areas of the Coquet catchment. CRAG have attempted to assimilate information on nitrate and nitrogen in a paper published on this website (Nitrogen in Water).
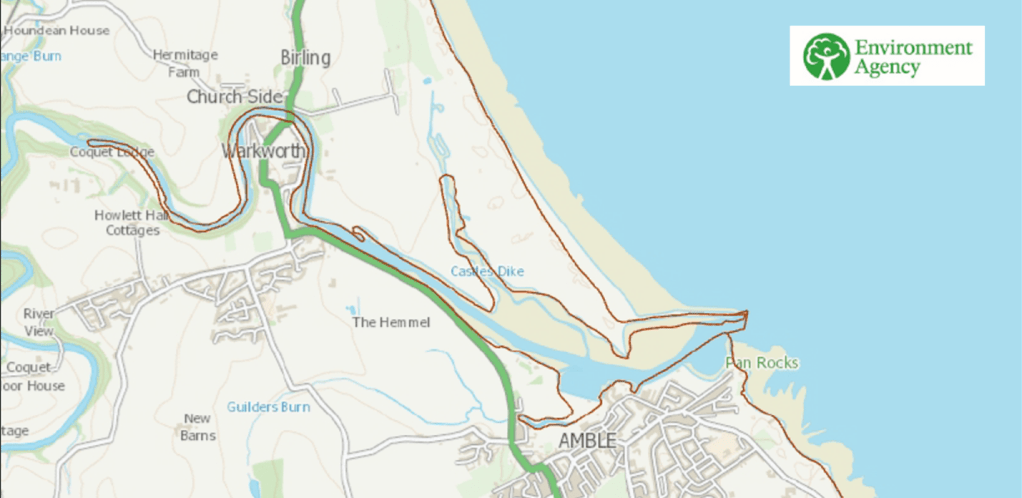
- UK Bathing Water Regulations (BWR) (https://www.legislation.gov.uk/uksi/2013/1675/contents/made) set standards for bathing waters, specifically E. coli and Intestinal Enterococci. Amble links and Warkworth beach are specifically named in this legislation and therefore must be monitored by the Environment Agency. CRAG is aiming to apply for bathing water status for the estuarine harbour near Little Shore in Amble. The Environment Agency map below indicates the extent of the estuarine waters near the Coquet mouth. The salinity of sea water is 35ppt (parts per thousand). The salinity of estuarine water is between 0.5ppt and 35ppt. The salinity at the Amble Pier, while hugely variable, averages at about 22ppt.
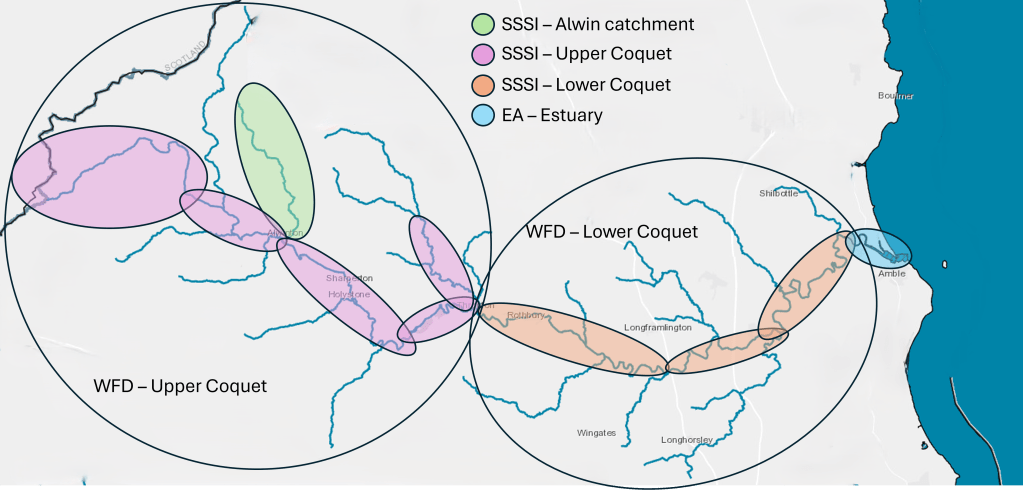
To assign the correct standards to the River Coquet, we need to place each water body into a category. We can identify 7 categories:
- SSSI Alwin catchment – the Alwin burn
- SSSI Upper Coquet – the main Coquet River from the source to the junction with the Wreigh burn and the Wreigh burn from the Netherton burn to the Coquet
- SSSI Lower Coquet – the main Coquet River from the Wreigh burn to the tidal limit
- EA Estuary – Amble and Warkworth from the tidal limit (Warkworth dam) to the sea
- WFD Upper Coquet – all burns upstream of the Wreigh burn, including the Usway burn, Ridless burn, Barrow burn, Holystone burn, Grasslees burn, Wreigh burn above the Netherton burn, and tributaries of the Wreigh burn (Back burn, Foxton and Netherton burns)
- WFD Lower Coquet – all burns between Wreigh burn and the tidal limit, including the Black burn, Forest burn, Todd burn, Swarland burn, Thirston and Longdike burns, Hazon burn and Tyelaw burn
Using the standards and categorisation of River Coquet water bodies described above, the standards against we will measure our chemical and biological tests are in the tables below.
Please note the following:
- Abbreviations for the ‘Source for Standards’ are as follows: CSMG – Common Standards Monitoring Guidance; WFD – Water Framework Directive; NIW – CRAG Nitrogen in Water paper; BWR – UK Bathing Water Regulations.
- cfu = colony forming units (i.e. the number of bacteria colonies formed on an agar plate at 36C in 24 hours from a 100mL sample).
- Our Hanna phosphate checker measures orthophosphate. We must divide our reading by 3.066 to convert this reading to orthophosphate as P for comparison with the standard here.
- Our Nitrate meters and nitrate test strips measure Nitrate. To convert values to Nitrate as N, we need to multiply the reading by 0.266.
- Dissolved inorganic nitrogen = Ammonia as N + Nitrate as N + Nitrite as N. For Ammonia to Ammonia as N conversion, multiply reading by 0.78. For Nitrite to Nitrite as N conversion, multiply reading by 0.304.
SSSI Alwin catchment
| Test | Source for standard | High quality | Good quality | Moderate quality | Poor quality |
| Dissolved oxygen | CSMG | > 85% saturation | < 85% saturation | ||
| Biological oxygen demand (BOD) | CSMG | < 2.5 mg/L | > 2.5 mg/L | ||
| pH | WFD | 6.0 – 9.0 | 4.7 – 6.0 | < 4.7 | |
| Temperature | WFD | < 20 C | 20-23 C | 23-28 C | > 28 C |
| Orthophosphate as P | CSMG | < 0.010 mg/L | >0.010 mg/L | ||
| Total Ammonia | CSMG | < 0.25 mg/L | > 0.25 mg/L | ||
| Nitrate as N | NIW | < 0.7 mg/L | 0.7-1.2 mg/L | 1.2-1.9 mg/L | > 1.9 mg/L |
| E. coli | BWR | < 500 cfu | 500-900 cfu | > 900 cfu | |
| Intestinal enterococci | BWR | < 200 cfu | 200-330 cfu | > 330 cfu | |
SSSI Upper Coquet
| Test | Source for standard | High quality | Good quality | Moderate quality | Poor quality |
| Dissolved oxygen | CSMG | > 85% saturation | < 85% saturation | ||
| Biological oxygen demand (BOD) | CSMG | < 2.5 mg/L | > 2.5 mg/L | ||
| pH | WFD | 6.0 – 9.0 | 4.7 – 6.0 | < 4.7 | |
| Temperature | WFD | < 20 C | 20-23 C | 23-28 C | > 28 C |
| Orthophosphate as P | CSMG | < 0.015 mg/L | >0.015 mg/L | ||
| Total Ammonia | CSMG | < 0.25 mg/L | > 0.25 mg/L | ||
| Nitrate as N | NIW | < 0.7 mg/L | 0.7-1.2 mg/L | 1.2-1.9 mg/L | > 1.9 mg/L |
| E. coli | BWR | < 500 cfu | 500-900 cfu | > 900 cfu | |
| Intestinal enterococci | BWR | < 200 cfu | 200-330 cfu | > 330 cfu | |
SSSI Lower Coquet
| Test | Source for standard | High quality | Good quality | Moderate quality | Poor quality |
| Dissolved oxygen | CSMG | > 85% saturation | < 85% saturation | ||
| Biological oxygen demand (BOD) | CSMG | < 2.5 mg/L | > 2.5 mg/L | ||
| pH | WFD | 6.0 – 9.0 | 4.7 – 6.0 | < 4.7 | |
| Temperature | WFD | < 20 C | 20-23 C | 23-28 C | > 28 C |
| Orthophosphate as P | CSMG | < 0.030 mg/L | >0.030 mg/L | ||
| Total Ammonia | CSMG | < 0.25 mg/L | > 0.25 mg/L | ||
| Nitrate as N | NIW | < 1.5 mg/L | 1.5-2.4 mg/L | 2.4-3.7 mg/L | > 3.7 mg/L |
| E. coli | BWR | < 500 cfu | 500-900 cfu | > 900 cfu | |
| Intestinal enterococci | BWR | < 200 cfu | 200-330 cfu | > 330 cfu | |
EA Estuary
| Test | Source for standard | High quality | Good quality | Moderate quality | Poor quality |
| Dissolved oxygen | WFD | > 6.2 mg/L | 4.4-6.2 mg/L | 2.6-4.4 mg/L | < 2.6 mg/L |
| pH | WFD | 6.0 – 9.0 | 4.7 – 6.0 | < 4.7 | |
| Temperature | WFD | < 20 C | 20-23 C | 23-28 C | > 28 C |
| Orthophosphate as P | EA (calculated using WFD) | < 0.031 mg/L | 0.031-0.051 mg/L | 0.051-0.155 mg/L | >0.155 mg/L |
| Total Ammonia | WFD | < 0.3 mg/L | 0.3-0.6 mg/L | 0.6-1.1 mg/L | > 1.1 mg/L |
| Dissolved inorganic nitrogen | NIW | < 1.4 mg/L | > 1.4 mg/L | ||
| E. coli | BWR | < 250 cfu** | 250 -500 cfu** | > 500 cfu** | |
| Intestinal enterococci | BWR | < 100 cfu** | 100 -185 cfu** | > 185 cfu** | |
WFD Upper Coquet catchment
| Test | Source for standard | High quality | Good quality | Moderate quality | Poor quality |
| Dissolved oxygen | WFD | > 80% saturation | 75%-80% saturation | 64%-75% saturation | < 64% saturation |
| Biological oxygen demand (BOD) | WFD | < 3.0 mg/L | 3.0-4.0 mg/L | 4.0-6.0 mg/L | |
| pH | WFD | 6.0 – 9.0 | 4.7 – 6.0 | < 4.7 | |
| Temperature | WFD | < 20 C | 20-23 C | 23-28 C | > 28 C |
| Orthophosphate as P | EA (calculated using WFD) | < 0.031 mg/L | 0.031-0.051 mg/L | 0.051-0.155 mg/L | >0.155 mg/L |
| Total Ammonia | WFD (Type 4) | < 0.20 mg/L | 0.20-0.30 mg/L | 0.30-0.75 mg/L | > 0.75 mg/L |
| Nitrate as N | NIW | < 0.7 mg/L | 0.7-1.2 mg/L | 1.2-1.9 mg/L | > 1.9 mg/L |
| E. coli | BWR | < 500 cfu | 500-900 cfu | > 900 cfu | |
| Intestinal enterococci | BWR | < 200 cfu | 200-330 cfu | > 330 cfu | |
WFD Lower Coquet catchment
| Test | Source for standard | High quality | Good quality | Moderate quality | Poor quality |
| Dissolved oxygen | WFD | > 80% saturation | 75%-80% saturation | 64%-75% saturation | < 64% saturation |
| Biological oxygen demand (BOD) | WFD | < 3.0 mg/L | 3.0-4.0 mg/L | 4.0-6.0 mg/L | |
| pH | WFD | 6.0 – 9.0 | 4.7 – 6.0 | < 4.7 | |
| Temperature | WFD | < 20 C | 20-23 C | 23-28 C | > 28 C |
| Orthophosphate as P | EA (calculated using WFD) | < 0.031 mg/L | 0.031-0.051 mg/L | 0.051-0.155 mg/L | >0.155 mg/L |
| Total Ammonia | WFD (Type 5) | < 0.30 mg/L | 0.30-0.60 mg/L | 0.60-1.10 mg/L | > 1.10 mg/L |
| Nitrate as N | NIW | < 1.5 mg/L | 1.5-2.4 mg/L | 2.4-3.7 mg/L | > 3.7 mg/L |
| E. coli | BWR | < 500 cfu | 500-900 cfu | > 900 cfu | |
| Intestinal enterococci | BWR | < 200 cfu | 200-330 cfu | > 330 cfu | |
Invasive weeds

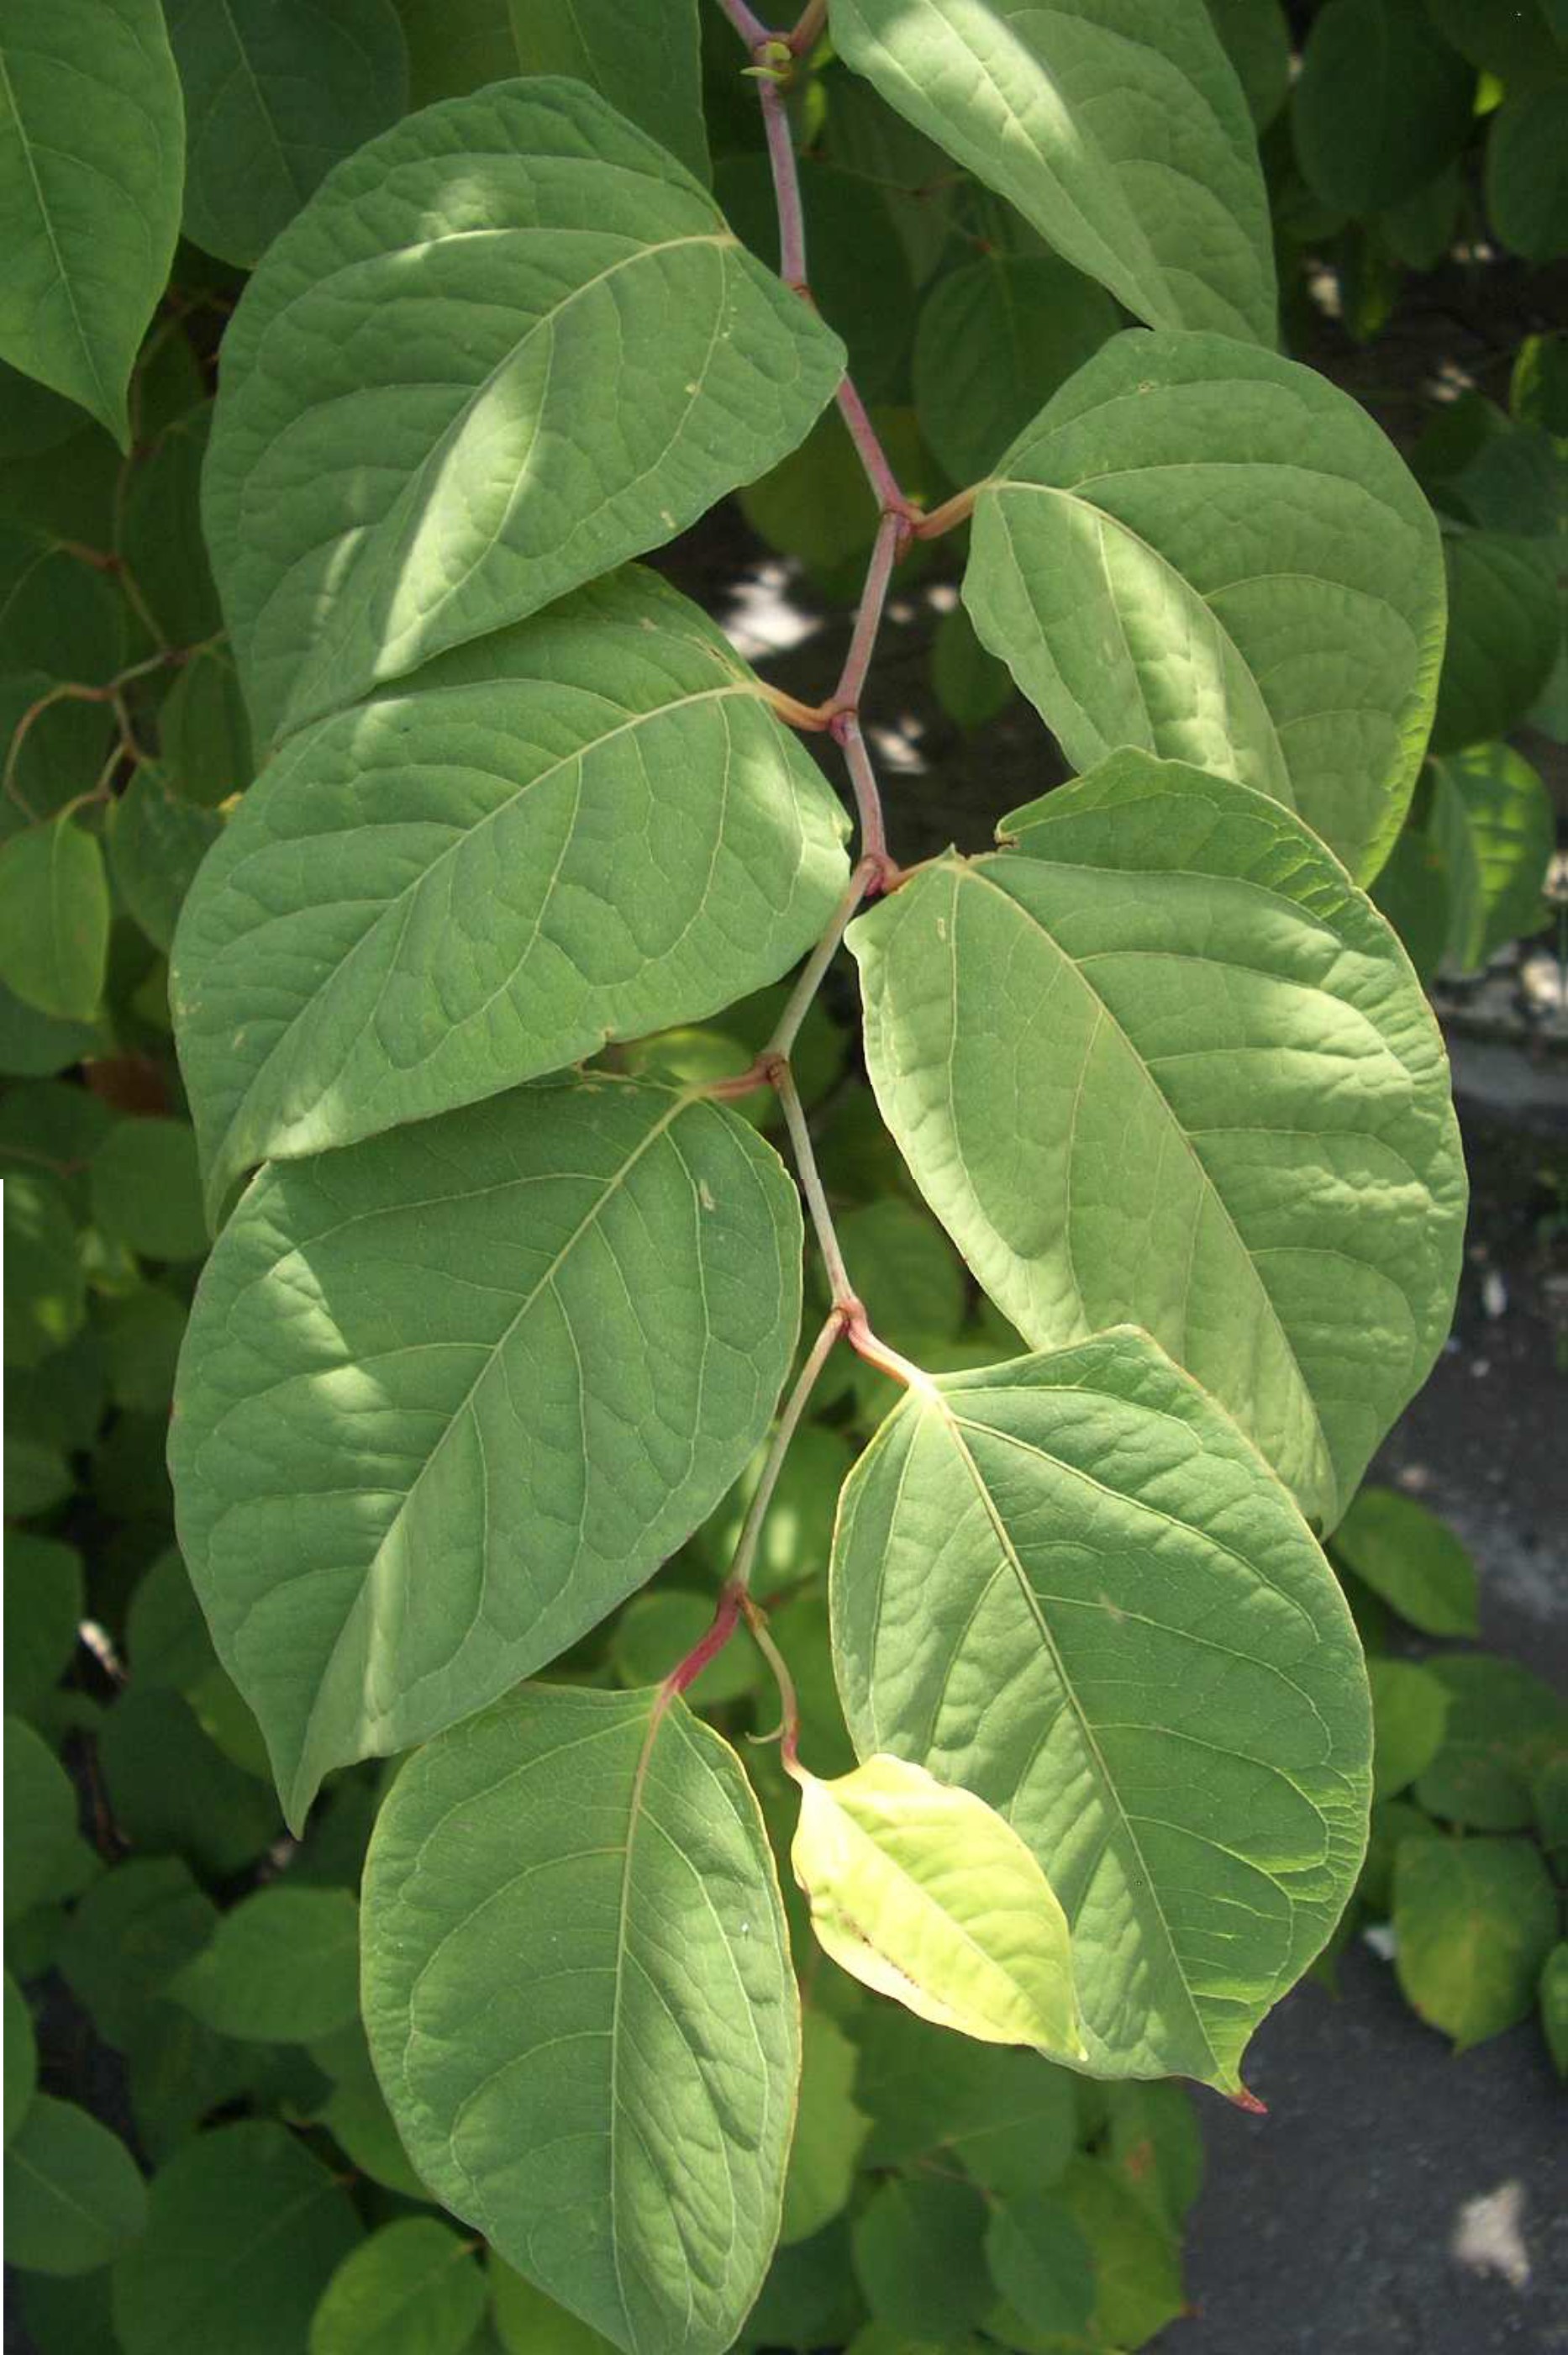
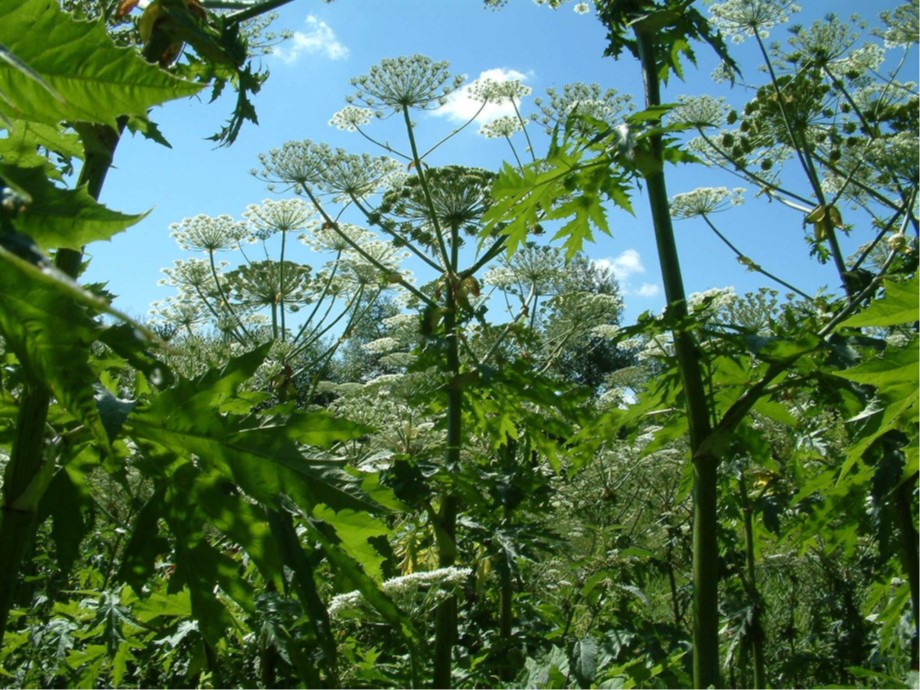
According to the WFD, a water body cannot be classified as high quality if any high-impact non-native species are present in the catchment. There are non-native animals and plants listed in the WFD. We have selected only 3 species of riparian (riverbank) plant species as our focus because we are aware that these species are commonly found along Northumberland rivers. These species are Japanese knotweed, Himalayan balsam and Giant hogweed.
Currently we have focussed our effort near the towns of Rothbury, Felton and Warkworth. We have run surveys and recorded sightings of Japanese knotweed and Himalayan balsam using our ‘CRAG invasive weeds’ EpiCollect project. Currently, we have found no Giant hogweed along the Coquet. Some work parties have undertaken Himalayan balsam removal.
We have begun working with the Northumberland Rivers Trust to develop a strategy for removing all of our target species from the Coquet. We are planning to link in with the North East Invasive Non-native Species Strategy and Action Plan (https://tweedforum.org/our-work/projects/north-east-invasive-non-native-species-strategy-and-action-plan/).
